
Have you ever noticed a slow interaction in your React application and aren’t quite sure how to start solving it? We might think that performance problems are too hard to fix because it’s too difficult to understand, but just like with Debugging Hard Things, don’t despair! We can still use the same tools to help us with performance profiling, just like we do when tracking down hard to find bugs.
If we get stuck:
- Take a pause with the beginner’s mindset. It’s okay to not know how something works. We can take some time to learn some of the basics to help us move forward.
- Remember that computers aren’t magic! 🪄 There’s a reason why this is happening. If we’re having trouble figuring it out, it might be for a reason that’s on a layer that we’re not familiar with.
- Know that we can break big problems into smaller ones and work systematically to rule out or narrow down theories.
Specifically when tackling performance issues, we can also help narrow this down by:
- Picking a specific measurable scenario to improve.
- Verifying that we can consistently reproduce the scenario.
- Profiling to find top slow areas.
- Making a hypothesis and testing it.
- Repeat steps 3 and 4 until we are happy with performance gains. This might take a lot of trial and error before we get our ah-ha moment!
To dig into what this means, let’s explore this further under a lens of trying to fix a slow focus in the WordPress Block Editor.
Pick a Scenario to Improve
When attempting to improve performance, instead of an ambiguous goal of trying to make an application fast, it helps to pick something concrete to improve that we can measure.
The more specific it is, the more likely it is that we’ll be able to find a smaller fix or actionable path forward.
Let’s first explore to see if our performance scenario is a good problem to tackle. In our example, we have reports that focus is a bit slow on large posts, but only when the ListView sidebar is open! How curious!
To verify performance issues quickly it can help to exacerbate the test conditions. For example, if we think performance degrades with the size of a post, try adding a lot of content. In another scenario if we think an issue is pretty sensitive to lower powered devices, we can try artificially limiting CPU speed in the browser performance tab or using a real device to confirm results. If we think a specific component or piece of logic is to blame, try quickly commenting out the entire section. We wouldn’t check that in, but it’s a quick way of pinpointing the general issue!
For this example, I created a large post with ~900 blocks and tried focusing with List View open. As we can see in the video below we can see visible lag or delay for between a click and when the actual editor caret moves.
So keeping track of what we’ve done so far, we’ve:
Make Sure We Can Consistently Reproduce The Behavior
Another thing to check before we try any code improvements, is see if we can consistently reproduce the behavior. This usually means that we can think through of a way to consistently measure how long an action took as well.
Many performance optimizations may make code more complex, can unintentionally break functionality, and may even slow down the application when applied incorrectly. So by default we should not accept any performance improvements unless the change does demonstrate that things are better (fewer renders, less delay for user interaction, etc). To demonstrate that a change helps performance, we need to be able to measure how fast that action was performed before and after a proposed fix.
If possible it’s also better to use measurements that can be reproduced by others, ideally via some automation on your continuous integration loop. Relying on manually profiling and requiring others to know how to performance profile can be a recipe for misinterpretation. Even experienced folks may get it wrong sometimes.
So going back to our slow focus example, it’s been reported by others as an issue, and we just verified it using our large test post. It does this consistently.
In our example, the WordPress block editor does have automated performance tests. However if we watch what the tests do with the following commands, we can see that these tests run with the ListView component closed. We have a bit of work to do to update tests, but let’s circle back to this one later.
npm run test-performance -- --wordpress-base-url=<base> --wordpress-username=<username>--wordpress-password=<password> --puppeteer-interactive packages/e2e-tests/specs/performance/post-editor.test.js

npm run test-performance -- --wordpress-base-url=<base> --wordpress-username=<username>--wordpress-password=<password> --puppeteer-interactive packages/e2e-tests/specs/performance/site-editor.test.js
Let’s update our checklist:
- The problem can be reproduced by me and others consistently ✅
- The scenario is measured by existing performance tests ❌
Get Familiar with our Tools
Performance tooling improves at a good pace! This is really lovely ✨
So after we have a good scenario to profile, a great next step is to catch up on documentation for our tools and common gotchas, even if we’re somewhat familiar with performance profiling.
If we don’t know what tools are available, we can search for it. This is true for most problems. Have a memory leak? Start with a general query like “Debugging Memory Leaks” and refine with follow up searches for your particular tech stack. In our case, a quick search for “Debugging Client Performance React” currently leads to articles on browser developer tools and React developer tools.
In the following section, I’ll be walking through some basics with Chrome devtools (other modern browsers have nice tooling as well) and React devtools, but this information is likely to get out of date. The next time you debug a client performance issue, save yourself some time by going back to documentation to learn what’s available!
Profiling in Developer Tools
One great place to start is by verifying an issue in the browser performance tab.
Let’s open browser devtools and click on the Performance tab, once we’re ready, hit record, then perform the slow action. In our case, we can click on two blocks a few times in the editor. After we stop recording get a lot of information on what just happened.
Chrome performance tab
What gets spit out may look a bit intimidating, but let’s dive deeper! One thing I recommend to do first is expand the performance window so we can get a better look at the information that’s provided. On this run I recorded with screenshots so I could get a better sense of what the editor was doing while tracing a particular function call.
In this case, we’ll want to zoom in on a slow focus event. We get hints of where this is with the long running task, the dip in FPS and the high CPU usage. Zooming in, we do indeed see that the focus call takes around 900ms to resolve.
Sometimes we might be able to spot a slow function specific to the component we can optimize, but in this case the call stack points at internal application state wiring and the React render workloop.
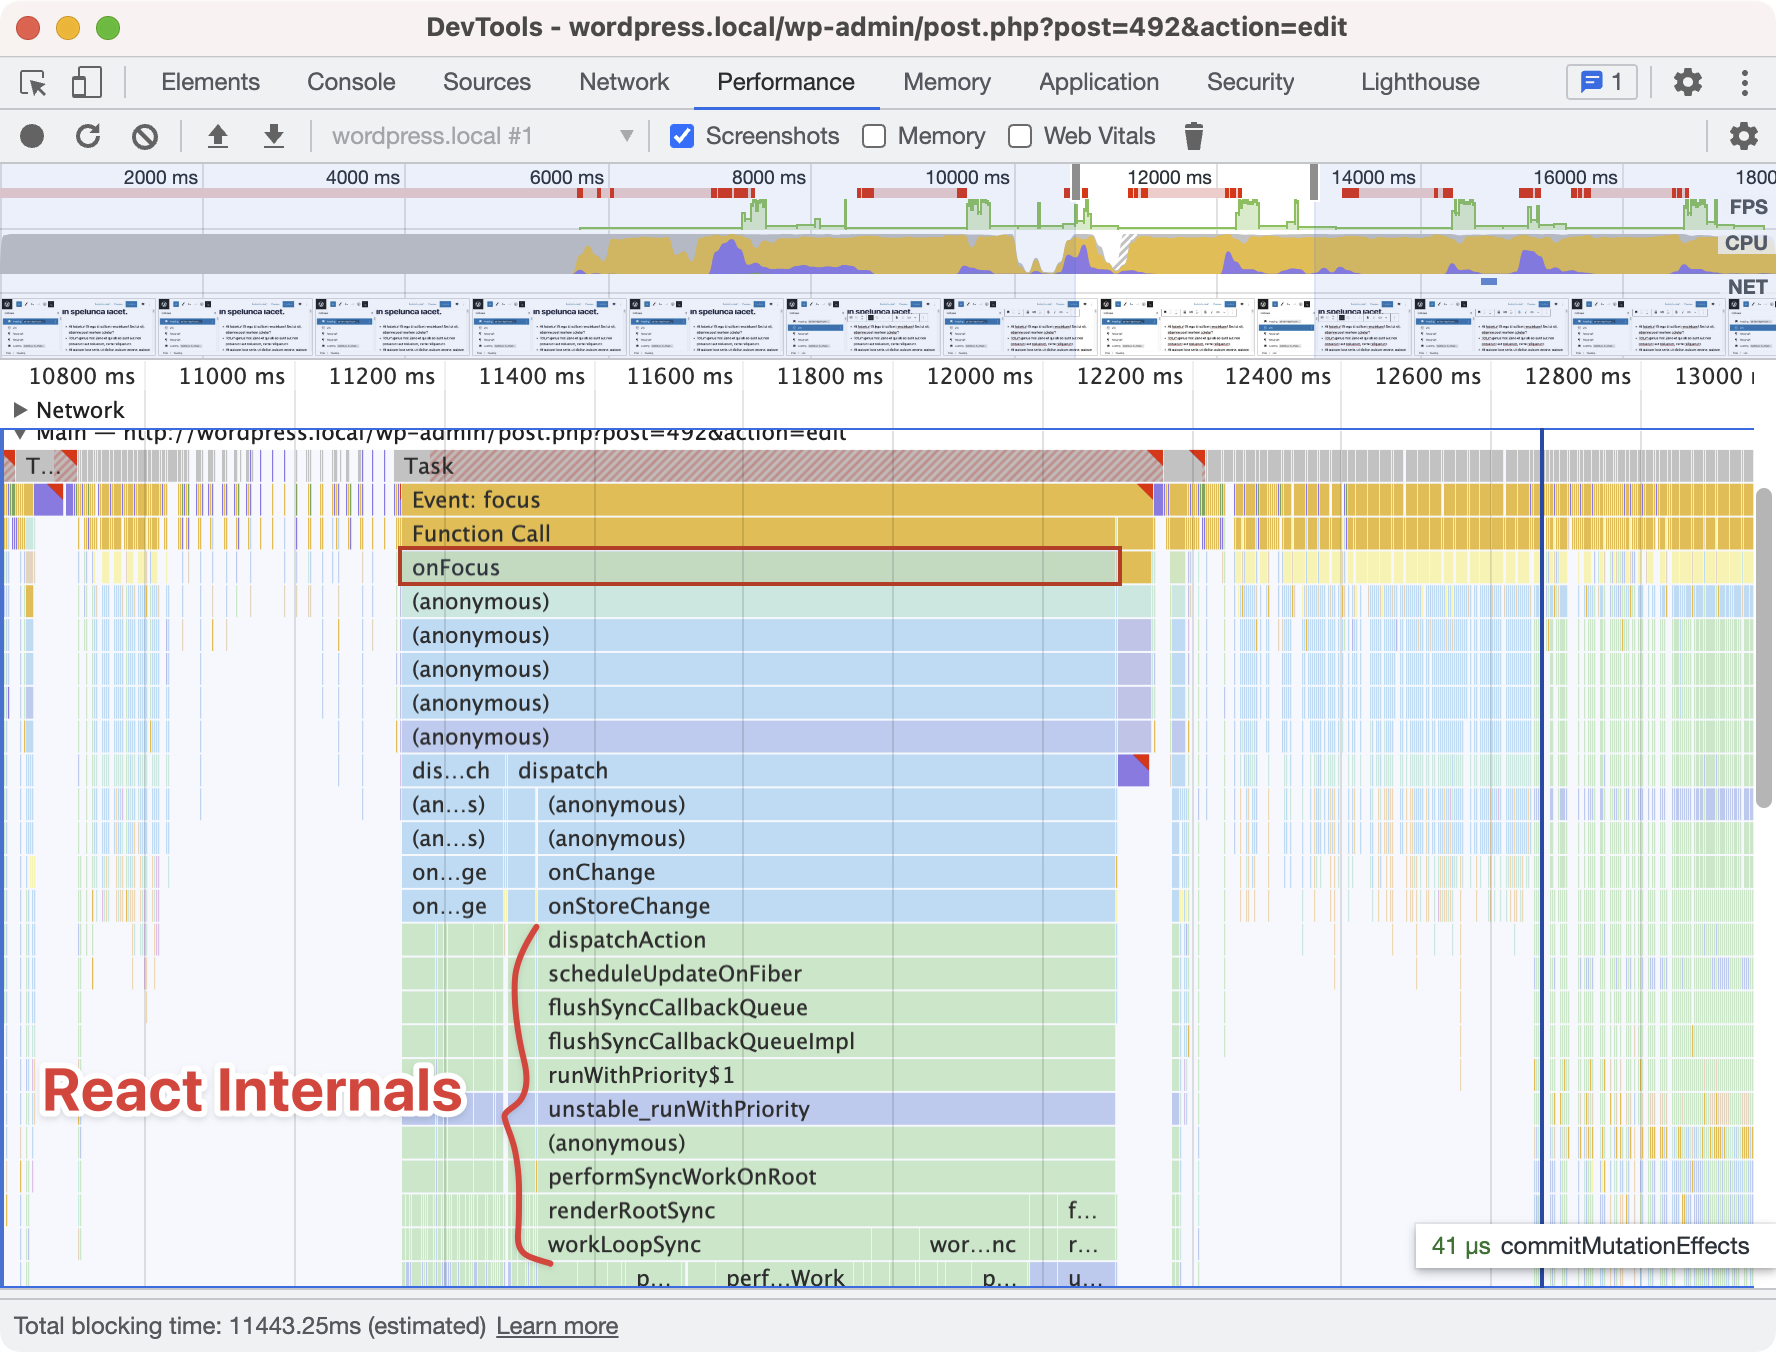
We’ll need to use a second tool to help see why this is taking up so much time!
React Devtool
Luckily for us, React has a browser extension called React Devtools.
To start, install React developer tools as a browser extension. Official documentation for React Devtools was a bit slim, but it does have an interactive tutorial!
Click on the profiler tab.
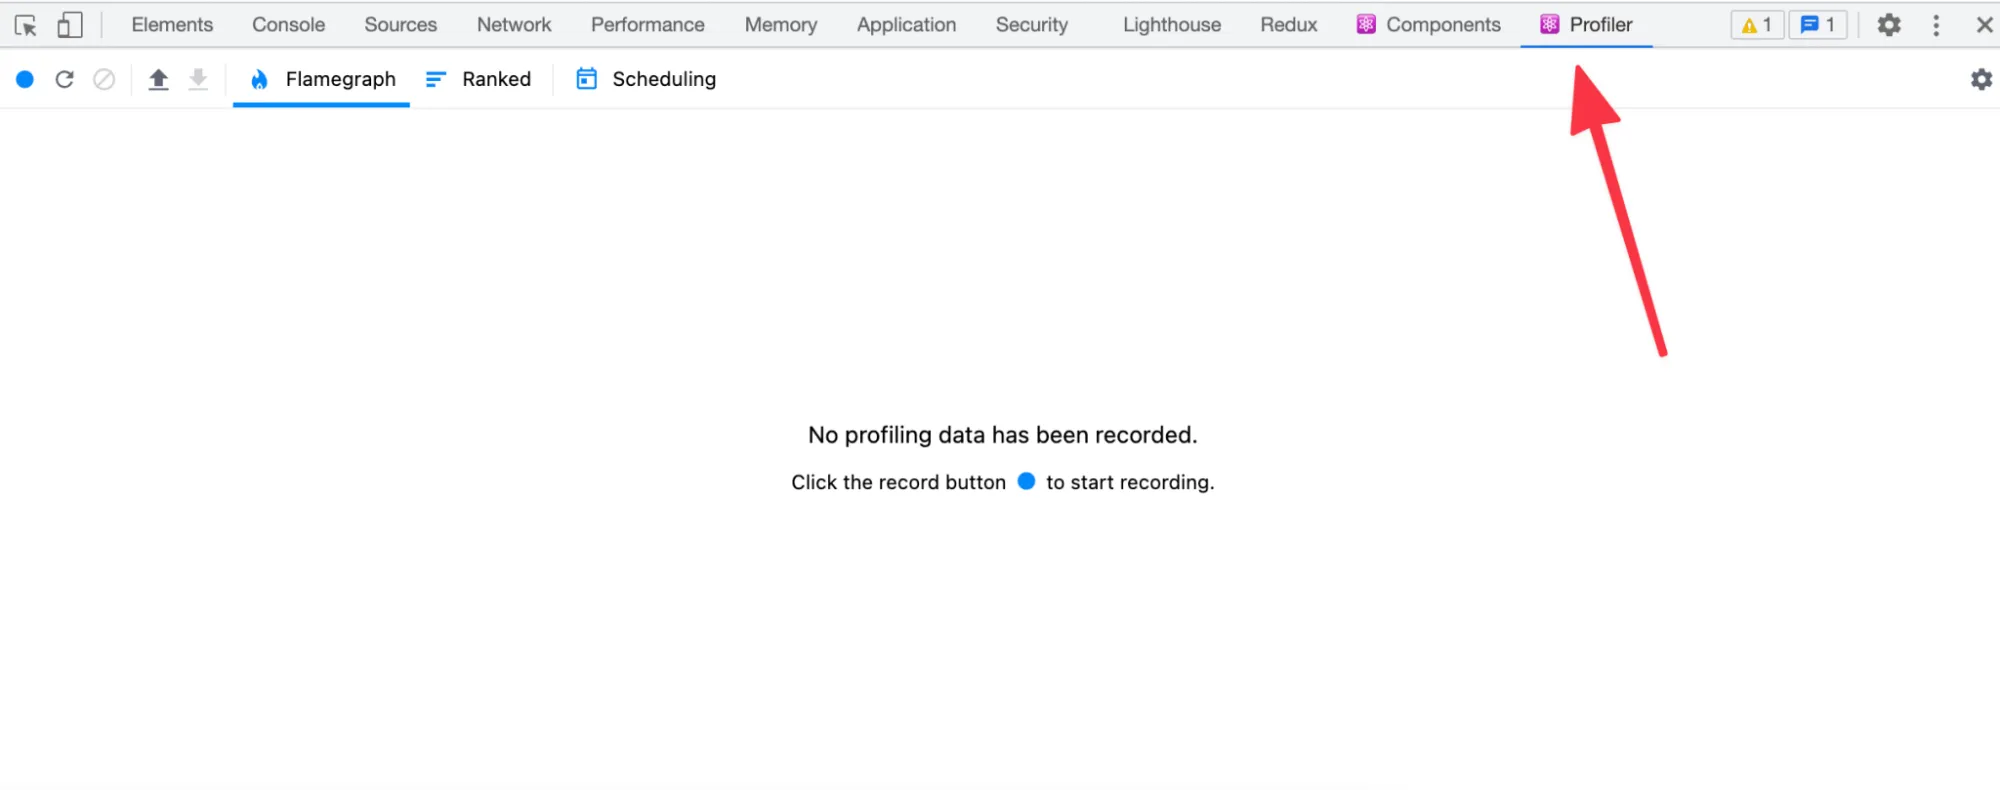
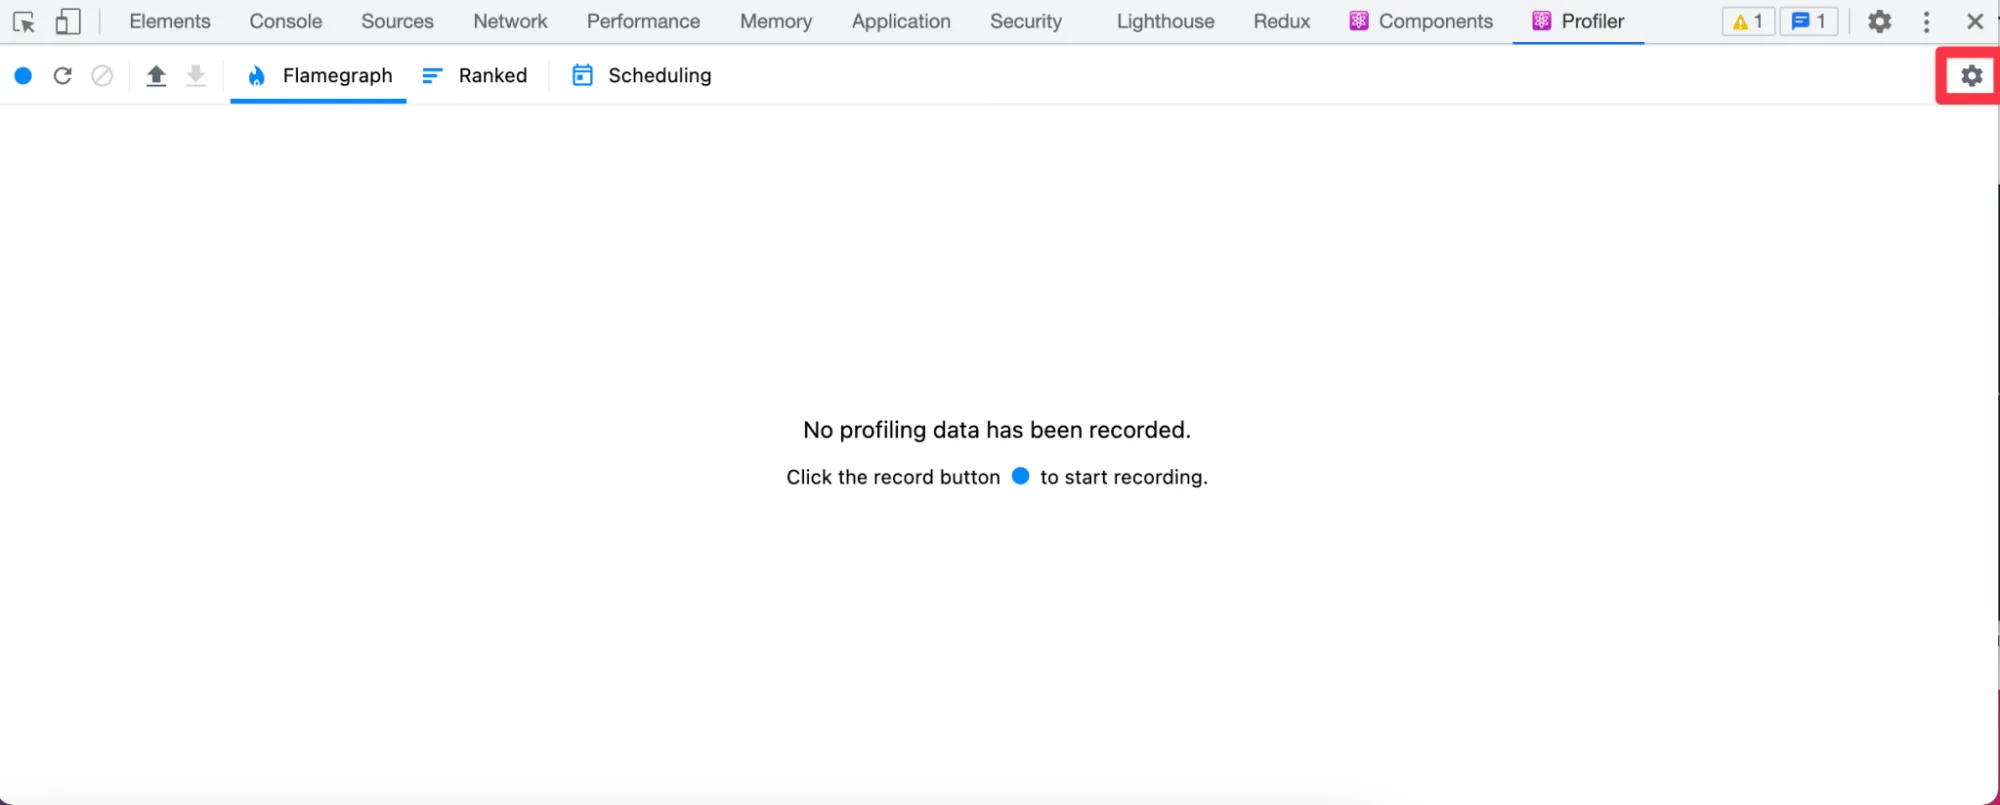
Then click on the gear in the top right corner:
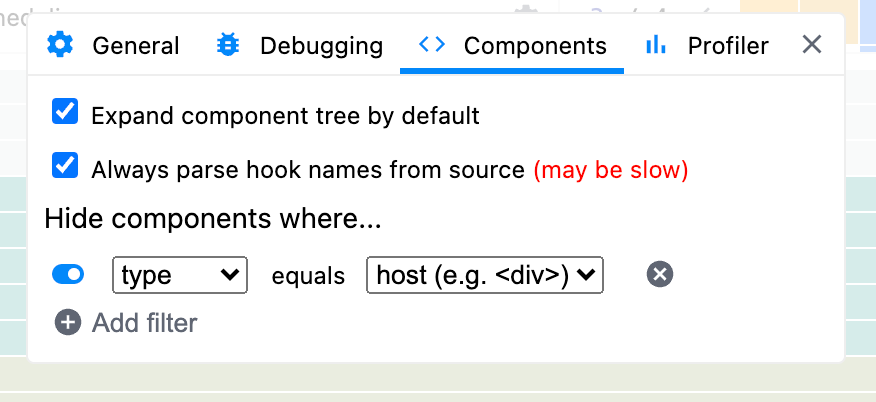
We can now set some defaults. Since I know we’re looking at renders ~900ms let’s ignore anything below 300ms. This helps reduce the noise when viewing results. Also check “Record why each component rendered while profiling”.

In the Component tab, check “Always parse hook names from source”.
Next, let hit the start profiling button:
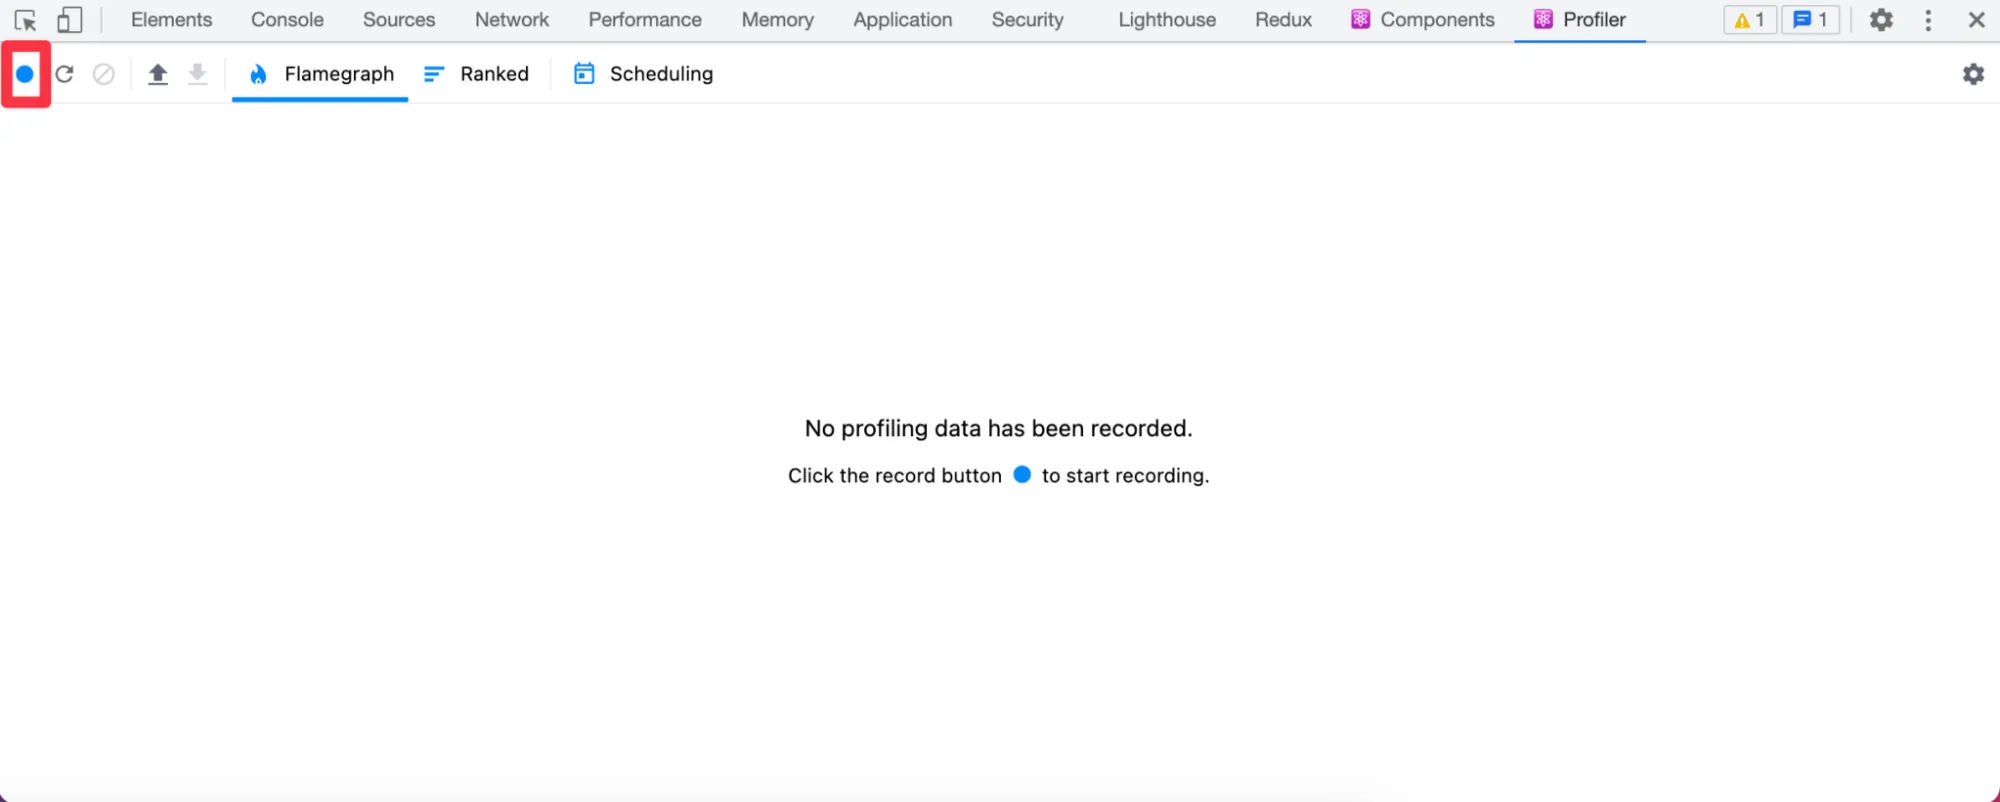
Perform the action we’re interesting in profiling. In this example I click on four different blocks in the main editor with ListView open. Click the profiling button again to stop recording.
The bars here may be colored differently. “Hotter” colors means it took more time to render and “cooler” colors less.
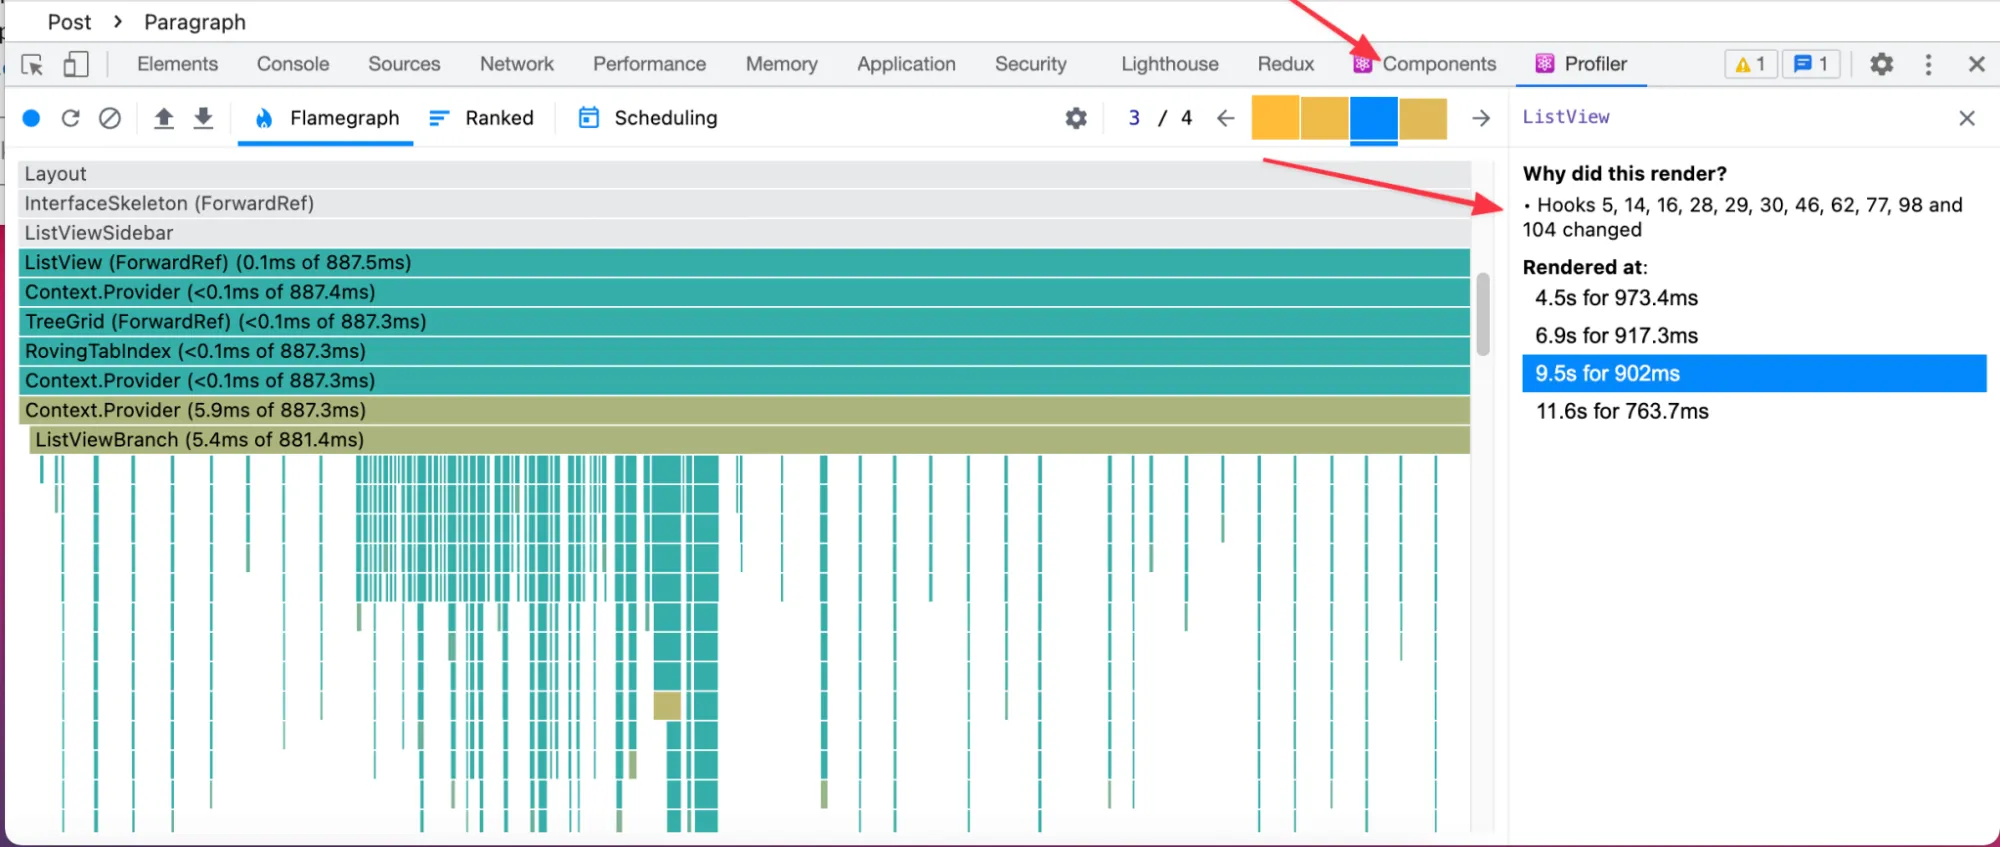
Now we can see four distinct events. Use the Flamegraph to see which root parent is causing the slowdown. In this case it’s ListView. The “Why did this render?” section shows that Hooks 5, 14, 16, 28, 29, 30, 46, 77, 98, and 104 have changed. It doesn’t look useful but with some extra work we can what those map to.
Where are the hook names? We’ll need to go back to the Components tab. We can see the numbered hooks in the hooks section. We may need to expand items to see all numbered hooks. Now we can match which hooks caused the update.
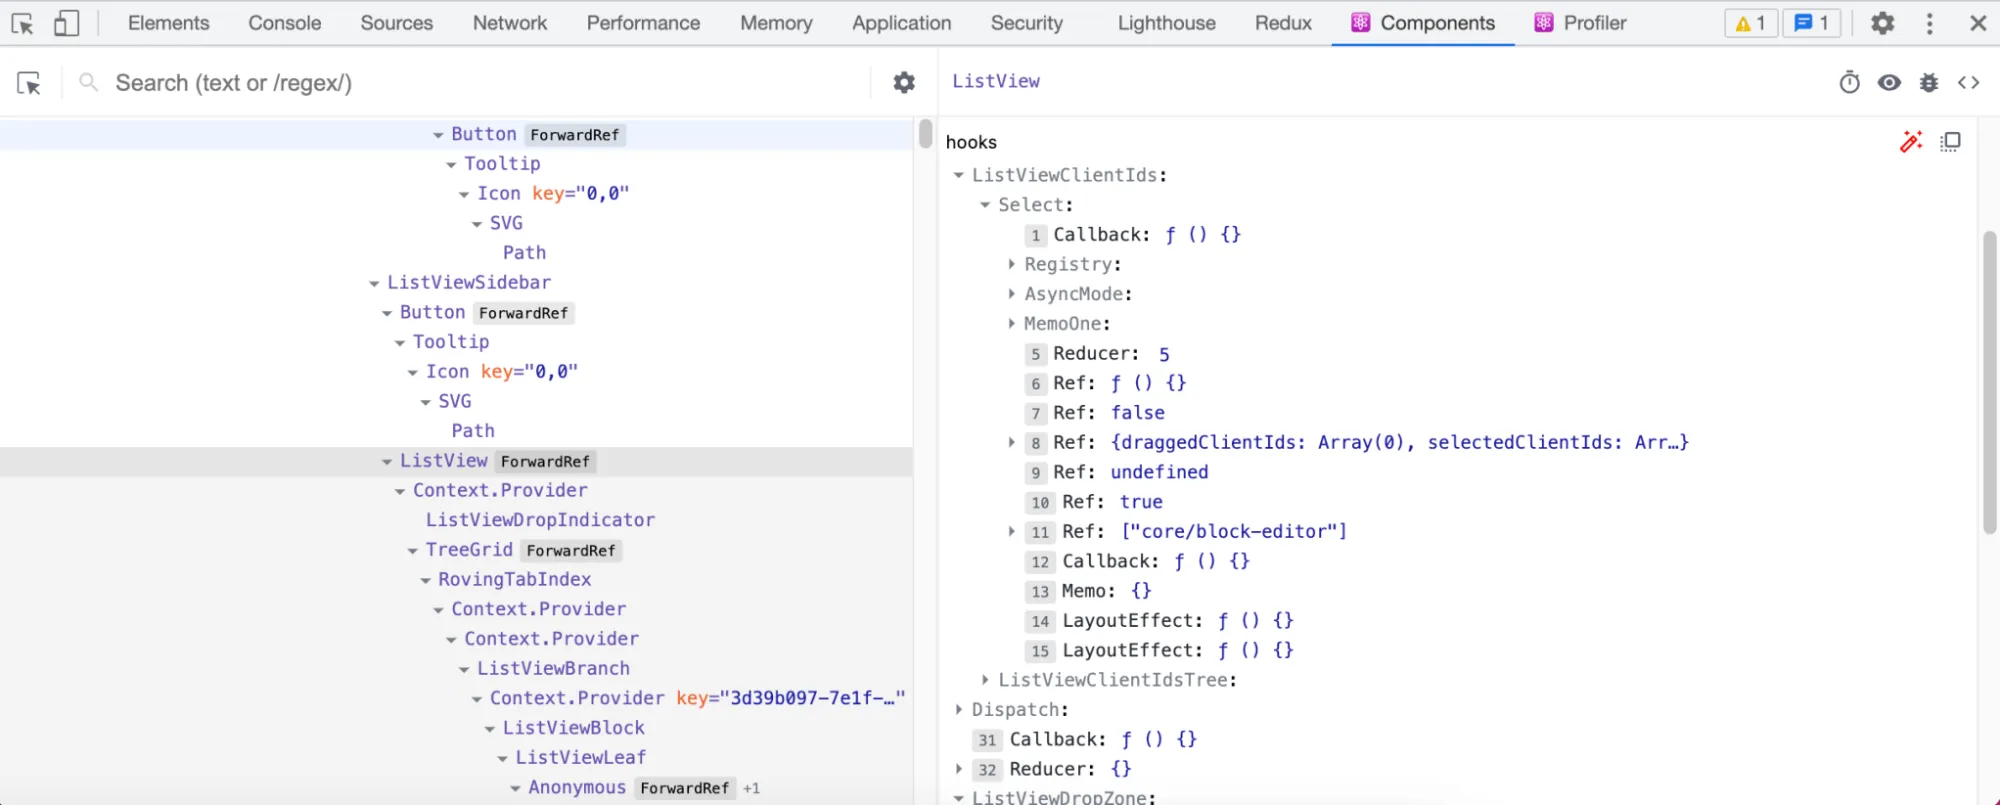
So profiling we see that ListView updates on block focus and it’s a slow render. We’re still not sure why this is happening.
It seems like we’re a bit stuck, but it’s not time to quit yet! Since we don’t know why this update is slow in React, let’s research what React is doing internally next.
- The problem can be reproduced by me and others consistently ✅
- The scenario is measured by existing performance tests ❌
- Manually profiling shows that focusing on a block causes a slow ListView render. 🤔
On React Rendering
To make sense of our profiling results, let pause and find some resources that let us understand what React is doing. How React works may change, so make sure to research after any major updates. Here’s what I came up with:
A core principle of React is that it’s a value UI, not a workaround for a slow DOM. React will not magically make updating a lot of things on a page fast. (Note that React 18 may have better abstractions for this type of optimization work).
React is “value UI”. Its core principle is that UI is a value, just like a string or an array. You can keep it in a variable, pass it around, use JavaScript control flow with it, and so on. That expressiveness is the point — not some diffing to avoid applying changes to the DOM.
— Dan (@dan_abramov) November 24, 2018
In practice, React currently uses a process called Reconciliation to determine what changed in its internal representation and what to update in the DOM. Doing this correctly is slow so React makes two assumptions with their heuristic algorithm when generating DOM output:
- Two elements of different types will produce different trees.
- The developer can hint at which child elements may be stable across different renders with a
keyprop.
A more practical takeaway knowing this while performance profiling is:
One’s mental model of how React works is likely incorrect.
By default, rendering a component will cause all child components to be recursively rendered. This is true even even if a child’s props don’t change! Check out a great visualization of this in React always Rerenders by Alex Sidorenco.
Another point to keep in mind that React uses shallow equality to determine if props have changed. This means that if we pass an array, object or function (like a handler function) with the same data, it will always trigger a render since the reference is changed.
This generally won’t matter for child components that aren’t rendered much, but it can make a difference in parent components that have many children.
<Foo onChange={ () => {} /> // a new onChange prop each time!

<Bar layout={ [ 'default' ] } /> // a new layout prop each time!

<Baz options={ { 'default' } } /> // a new options object each time!
There are a few tools we can use to avoid re-renders, namely useCallback, useMemo, and React.memo in the right situations. However, it’s also easy to apply these incorrectly and have it make no impact or trigger bugs since the component isn’t updating as often as they should. When using these tools make sure we can measure the effects of our change!
Note that React internal implementation details may change too, so we also need to be careful not to over optimize on how React works currently.
For further reading see also FAQ Internals and Reconciliation. A Mostly Complete Guide to React Render Behavior and React always renders.
So far we have:
- The problem can be reproduced by me and others consistently ✅
- The scenario is measured by existing performance tests ❌
- Manually profiling shows that focusing on a block causes a slow ListView render. 🤔
- Researched how React works to better understand profiling results. ✅
Make a Hypothesis
With our profiling tools in place and a basic understanding of how React works, we can then make a few hypotheses and test them out. For right now, our hypothesis is: “Focus is slow because too many things are re-rendering in ListView.”
- The problem can be reproduced by me and others consistently ✅
- The scenario is measured by existing performance tests ❌
- Manually profiling shows that focusing on a block causes a slow ListView render. 🤔
- Researched on how React works to better understand profiling results. ✅
-Hypothesis: Focus is slow because too many things are re-rendering in ListView.
Other hypotheses might look like X is slow because:
- We make too many requests
- The requests are too big
- The amount of data we’re working with is too large
- We’re caching but not using the cache / we’re caching the wrong thing / the cache is never valid
- Our algorithm is something bad like O(n3) on a large list when it can be improved
- We are taking up too many cycles when working with expensive tasks and need to break up work to keep things user input responsive. (The overall task will then take longer to complete, but we shouldn’t see any long running script warnings or click/typing jank).
- and so on…
Let’s Measure Things!
While starting with manual performance profiling is a good way to get ideas, it’s much better if we can consistently measure our performance changes.
In the WordPress block editor, we have some automated performance tests that run. Some of the test cases include loading a large post and measuring things like typing and focus speed.

For this issue, I made sure to update the WordPress block editor performance tests to run with ListView open. Changes look a bit like this for folks working more closely in WordPress block editor. For other problems we might need to create a new performance suite to time our actions that we’d like to improve.
In this instance, even though the dev loop is around 50 minutes or so to get results, it’s a great way to test our hypotheses without relying on reviewers to be very proficient with performance profiling and interpretation.

Slowing down to add performance tests may save you time! On my first investigation attempt, I did try to memo some suspected component props but it had no effect! I only found this out by adding and waiting for the performance results. Without measuring, we might have landed some code that makes things more complex and doesn’t speed anything up!
- The problem can be reproduced by me and others consistently ✅
- Researched on how React works to better understand profiling results. ✅
- Hypothesis: Focus is slow because too many things are re-rendering in list view
- The scenario is measured by our updated performance tests ✅
Refine our Hypothesis
Unless we’re lucky (or very experienced on a problem we’ve seen before) refining a hypothesis or testing new ideas will often be the most time consuming part. Work here basically boils down to:
- Thinking of a new idea or modifying an existing hypothesis
- Testing the idea by measuring performance results before and after a potential fix or test to rule out the hypothesis.
- Repeat, if the idea doesn’t give us the results we’re expecting.

It’s often at this stage, where we might get the most frustrated or stumped. Just like with Debugging Hard things, try a few techniques to unstick ourselves.
- Assemble our known clues – Keep a list of what you done! It’s probably more than you think. Note what you know and what you’ve ruled out. Revisit your clues often!
- Surface for air. Take a break and write out your findings so far. Explaining a problem to someone else can also work too.
- Understand a system more deeply – Research a layer you don’t know enough about. For example, understanding the tools that are available to you or gaining a deeper understanding of how something works like React rendering.
- Reduce the problem – If you can toggle the performance behavior, try ruling out what it can’t be to help narrow it down. To save yourself time, you can do this in pretty broad strokes. Like in client performance, try commenting out entire components. If the performance issue is still there, we can rule out those component as being a hotspot.
In our example, what I did next was review what I had done so far, and go through profiling results more carefully. For other performance issues it may take much more trial and error.
Looking at the React profiling results, one common pattern that emerges is that hooks update because selectedClientIds update. That array is a list of the currently selected blocks, so this makes sense… but why is it so slow?
From our React research we know that rendering a component will cause all child components to be recursively rendered. So the ListView component is rendering itself and all of its children on each block focus! When there are many blocks it’s slow.
I thought of two ways to fix this:
- Simplify the component and move querying of
selectedClientIdsto the child components (#35706) - Memo the ListView child component, so it costs less to re-render ListView. (#36063)
Taking care to demonstrate that there was a slow focus call before and after an improved focus call after, I actually ended up implementing both solutions. My first attempt that moved where selectedClientIds was queried was too fragile. Almost immediately, another feature PR needed that information on the parent ListView component again! Remember that there may be multiple ways of handling a performance issue. Be flexible and be aware of your project needs!
- The problem can be reproduced by me and others consistently ✅
- Researched on how React works to better understand profiling results. ✅
- Hypothesis: Focus is slow because too many things are re-rendering in list view ✅
- The scenario is measured by our updated performance tests ✅
- We verified a hypothesis and have confirmed that a fix has measurable results ✅
Summary
So putting this all together my performance profiling loop is:
- Picking a specific measurable scenario to improve.
- Verifying that we can consistently reproduce the scenario.
- Profiling to find top slow areas.
- Making a hypothesis and test it.
- Repeat steps 3 and 4 until we are happy with performance gains. This might take a lot of trial and error before we get our ah-ha moment!
If we get stuck, we can use the same techniques as we do when Debugging Hard Things:
- Put together a clues list of everything we’ve done so far and revisit it often!
- Take a break and write out your findings so far.
- Research what tools are available to help investigate the problem or learn more deeply about a layer you might not know about. For example React Rendering when looking at client performance issues.
- Reduce the problem so we can narrow down the suspected area